
China’s Phantom Deindustrialisation
Standard measures say China is deindustrialising along with the G7. But that’s not real.

By Richard Baldwin, Professor of International Economics, IMD Business School, Lausanne. 3 July 2026. Factful Friday.
China’s industries are the talk of the town in capitals around the world. China’s manufacturing-led growth, it is said, is menacing manufacturing globally. The “second China shock,” and all that.
But is the ‘talk of the town’ so obviously fact-based?
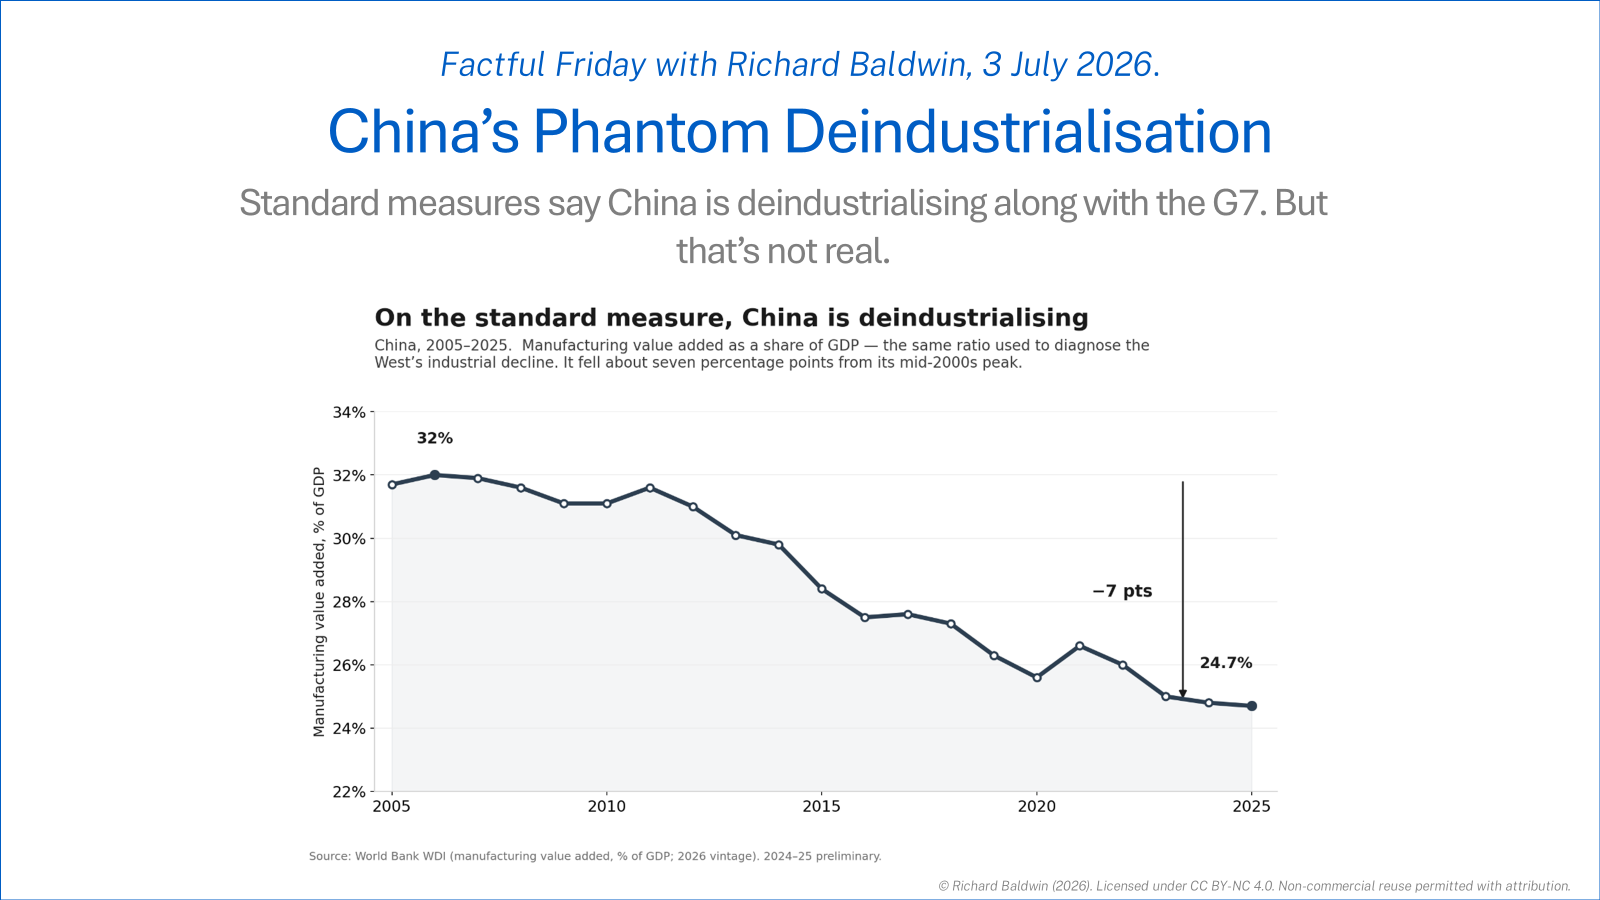
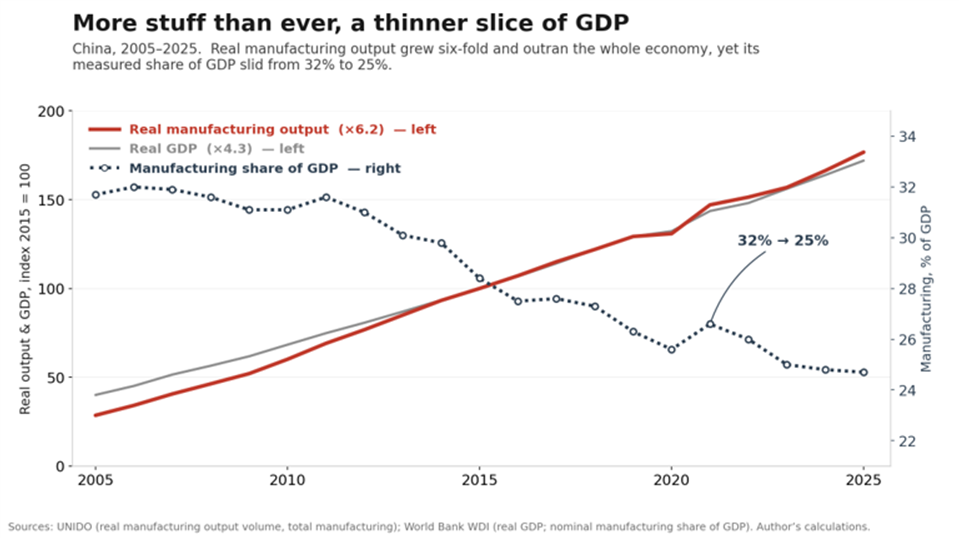
Chinese exports are growing, but so too is its economy. According to the standard measure, China is deindustrialising. Its manufacturing GDP share has been falling for 15 years. A lot. From a peak near 32% in the mid-2000s to under 25% today. And it’s still falling (see the chart below).
That’s an awkward fact for the talk of the town.
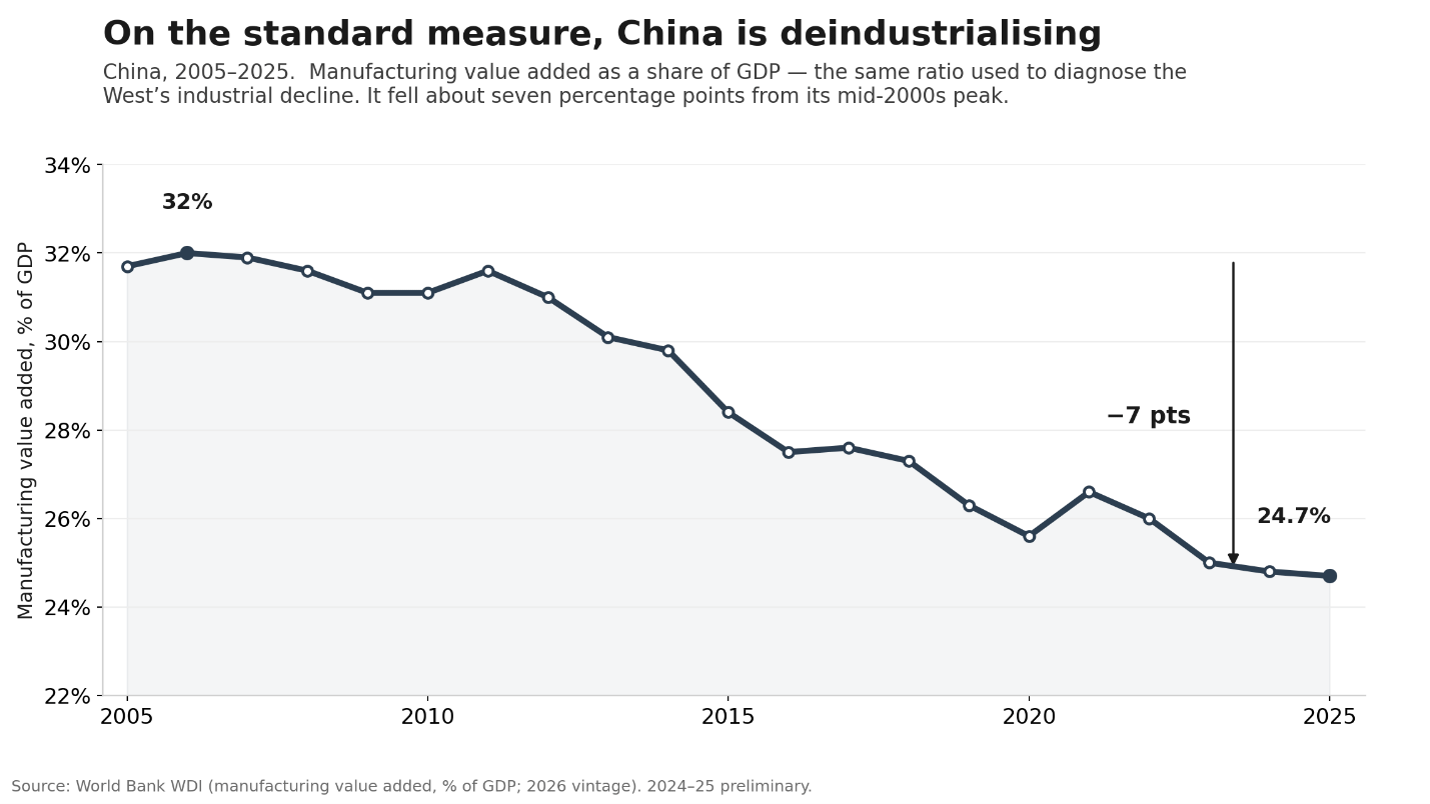
If China’s manufacturing share of GDP is falling, then its economy is growing even faster than its manufacturing. That gives the whole ‘overproduction’ story a different vibe. The overproduction story asserts that China is driving its economy by dumping manufactured goods on the rest of the world. A falling manufacturing share asserts that manufactures are not the primary growth driver since they are growing slower than other sectors.
That’s the topic of this week’s Factful Friday.
Spoiler for readers in a hurry. No, China is not deindustrialising. But neither is it industrialising. In real terms, its manufacturing GDP share has been stalled for a decade. The ratio in real terms rose up to about 28% by 2014 (see red line in chart below). The level of the red line depends on the 2015 anchor; its shape does not. For a decade, the manufacturing sector has not been leading the Chinese economy in a statistical sense.
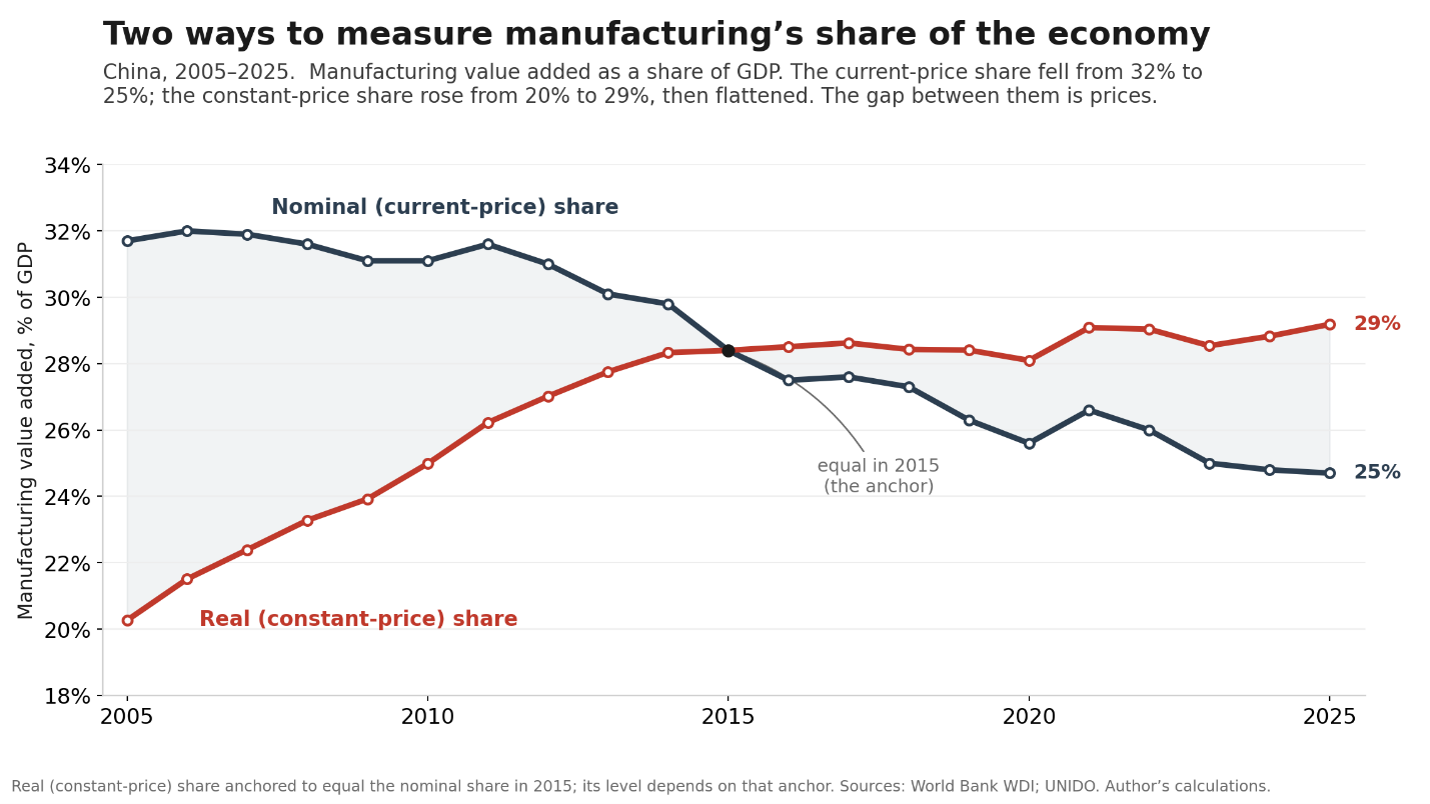
Digging into the scissors (real up, nominal down).
Why do the nominal and real manufacturing shares tell such different stories?
A share of GDP measured in current prices is the ratio of two things, each of which is the multiplication of two things: 1) how much is made times 2) its price. The standard industrialisation measure is thus the nominal value of manufacturing output divided by the nominal value of the whole economy’s output.
Plainly that ratio is sensitive to changes in the relative price of manufactured goods compared to the output of the whole economy. And indeed, the relative price of Chinese manufactures collapsed during these years.
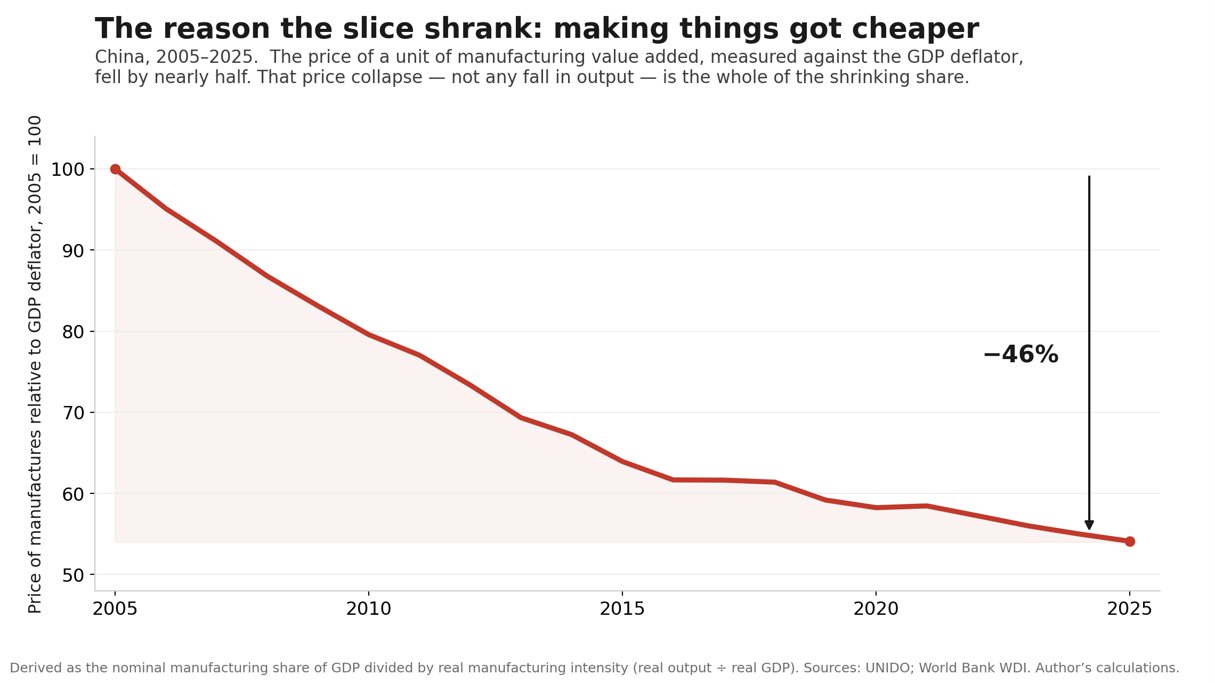
The chart below shows the price of a unit of Chinese manufacturing value added against the GDP deflator. It plots, in other words, manufactures priced against everything the economy produces. This relative price fell about 46% from 2005 to 2025.
That is why the nominal manufacturing share fell while the real ratio rose. The whole of the drop in the nominal ratio was due to falling prices in the manufacturing sector, not falling output. This point has long been recognised in the structural change literature.[i] and has been emphasised again by Houseman (2018) in her work on manufacturing measurement and productivity.
Why did the relative price of manufacturing fall in China?
The bulk of Chinese non-manufactured output is in the service sector, so the real question is: Why would the price of manufactures fall relative to services?
The answer has a fine heritage in the economics profession. It’s called Baumol’s Law. Productivity in making things grows fast and that lowers per unit cost fast. Productivity in services grows more slowly so the relative cost of making goods versus services falls (see chart above).
On top of this Baumol effect, which operates in most economies, there is a China-specific factor that is driving down manufacturing prices even faster. In China they call this competition “involution.”
If you think the competition is tough outside of China, you should see it inside the country. China experts talk about the ruinous internal scramble in which too many domestic firms, egged on by rival local governments, drive down prices until nobody makes money.
Summary and concluding remarks.
So. Is China deindustrialising? The standard nominal ratio says ‘yes’. The real ratio says ‘no’. The disagreement is illuminating. Let me explain.
The Chinese manufacturing sector is becoming increasingly competitive and that is driving down relative prices. The relative price of manufactures has fallen 46% against the broader Chinese price index since 2005.
That explains China’s “phantom deindustrialisation.” Namely, a falling nominal share that hides rising real output.
What about China Shock 1.0 and 2.0? Are those popular misconceptions?
There is no doubt that the expansion of the Chinese manufacturing sector has been an era-defining phenomenon. The rise can be seen in the red line in the chart below. Real manufacturing output in 2025 is more than six times its 2005 level. That’s amazing. That’s the China shock 1.0 and 2.0 in a nutshell.
Over the same twenty years, the whole economy (the grey line) grew only four-and-a-third times. So, manufacturing did outrun the economy. But only up to the mid-2010s. The disconnect in the popular discourse comes from the fact that policy makers in Europe and the US only see the rise in manufacturing, not the fact that the broader economy rose as fast as manufacturing since the mid-2010s.
Concluding remarks.
The falling nominal ratio is not a statistical quirk. It reflects the most consequential fact about Chinese manufacturing: Chinese goods are getting cheaper at an astounding pace. Fast enough to distort the whole economy, maybe even the whole world economy.
That price collapse is also why the Chinese are such fearsome competitors globally. It is why the rest of the world’s industry feels squeezed, and why politicians are responding with plans to hobble Chinese exports.
But it is important to note that China is not a manufacturing-led economy in the structural sense. Since the mid-2010s, its manufacturing has grown at the same real rate as the overall economy.
And that’s it for another Factful Friday!
References
Baldwin, R. (2026, January 1). How the G7 deindustrialised: Seven charts showing how dominance was lost. Richard Baldwin Substack. https://rbaldwin.substack.com/p/how-the-g7-deindustrialised
Baumol, W. J. (1967). Macroeconomics of unbalanced growth: The anatomy of urban crisis. American Economic Review, 57(3), 415–426.
Herrendorf, B., Rogerson, R., & Valentinyi, Á. (2014). Growth and structural transformation. In P. Aghion & S. N. Durlauf (Eds.), Handbook of economic growth (Vol. 2, pp. 855–941). Elsevier. https://doi.org/10.1016/B978-0-444-53540-5.00006-9
Houseman, S. N. (2018). Understanding the decline of U.S. manufacturing employment (Upjohn Institute Working Paper No. 18-287). W. E. Upjohn Institute for Employment Research. https://doi.org/10.17848/wp18-287
Liboreiro, P. R., Fernández, R., & García, C. (2021). The drivers of deindustrialization in advanced economies: A hierarchical structural decomposition analysis. Structural Change and Economic Dynamics, 58, 138–152. https://doi.org/10.1016/j.strueco.2021.04.009
Rowthorn, R., & Ramaswamy, R. (1999). Growth, trade, and deindustrialization. IMF Staff Papers, 46(1), 18–41. https://doi.org/10.2307/3867633
[i][i] For example, Rowthorn & Ramaswamy, 1999; Herrendorf, Rogerson & Valentinyi, 2014; Liboreiro et al, 2021.2
This is an amazing essay. Professor Baldwin’s methods is very revealing and original.
And I think his conclusion is consistent with common sense: China has not deindustrialized.
I applied the same method to the United States. The result is very different. Over the past two decades, America’s manufacturing share did not only fall in nominal terms, from 12.98% to 9.4%. Its real manufacturing share also declined, from 11.74% to around 10%.
That means U.S. deindustrialization was real. China’s case is largely a nominal-share illusion created by falling relative manufacturing prices. America’s case reflects a real decline in manufacturing’s weight within the economy.
Does this tie into the housing bust in China at all? It seems possible the Chinese GDP figures could be inflated due to the housing bubble. If much of the housing built was malinvestment that is now due to government policy taking a very long time to mark-to-market, wouldn't that distort the picture?